Demystify Data: How Data Can Inform Your Strategy

A change in strategy for nonprofit organizations is often driven by a shift in trends: a change in demographics requires greater capacity for serving non-English speakers; a drop in test scores for reading comprehension prompts new approaches to early learning; or a spike in extinctions directs the focus of those involved in habitat preservation.
When it comes to strategy development, keeping up with the key trends in your environment is of paramount importance. It’s as much about learning fast as it is about planning well. Good data helps. This blog dives into the four primary uses of data to inform strategy.
First, data helps to identify a need or problem.
And, data helps to confirm what your organization does best – it’s competitive advantage.
Next, data helps to focus your effort where you can make the most impact.
Finally, good data is essential to learning and adapting.
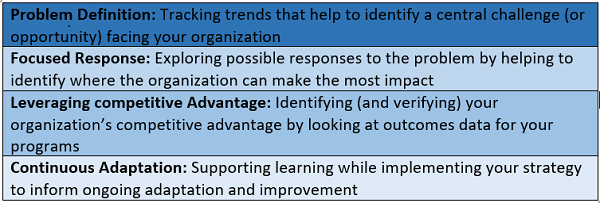
This last point is key. Our world is changing so rapidly that we need to have the systems in place – particularly systems for data collection and analysis – to support leaning and adaptation.
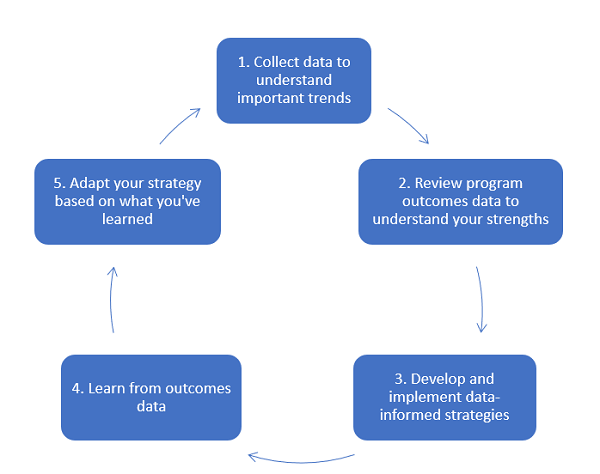
If you think of strategic learning as a cycle that informs both thinking and action, data is first gathered to understand trends in your environment or market – and where the need is greatest; next program data helps you understand where you are currently making the most difference; then, you develop programs based on the data you’ve collected internally and externally; by collecting and analyzing outcomes data you can honestly assess how well things are working; and, finally, based on your assessment you can adapt your programs to be more effective.
The diagram below describes a cycle of strategic learning to inform thinking and action.
One of the key principles of La Piana’s Real-Time Strategic Planning is that traditional planning no longer supports nonprofit organizations in a rapidly changing world. We can’t afford to put action on hold while we take a year to develop a strategic plan. Shorter cycles of thinking and action call for a flow of good data to support learning and adaption. Small shifts require small recalibrations. Seismic shifts in trends like a hostile regulatory environment or a dramatic increase in natural disasters may require a bolder change in strategy.
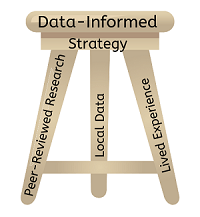
Data is key. But what kind of data do you need to inform your strategy in the first place? Three sources of data form an ideal “tri-pod” to support strategy. First, peer-reviewed research on important trends and successful programs, or evidence-based interventions, provide a legitimizing foundation. These might include research on threatened species conducted by a university or nonprofit science center or a study of a proven method of decreasing chronic disease promoted by the CDC.
Second, it is helpful to look at local data. For example, environmental groups may gather data on water quality to focus their efforts on the most polluted rivers or beaches.
Finally, it is essential to collect information about the lived experience of people in the community to adapt evidence-based interventions to meet the specific needs of your community. This might include gathering information from local constituents who are living with asthma or experiencing the (often uneven) impact of environmental degradation.
One example of a data-informed approach to strategy development is the use of the Misery Index developed by Dr. Jamshid Damooei, Director of the Economics Program in the School of Management at California Lutheran University. The index combines six primary indicators of childhood poverty, including the percentage of children age 5 and under living in below the Federal Poverty Level, the percentage of adults over 25 without a high school diploma, and the percentage of English-language learners.
The index helps to target interventions in the most vulnerable communities. For example, Fresno’s Cradle to Career Collaborative used a version of Damooei’s index to build a plan for focusing community resources on early childhood development for the most vulnerable children. Later, the index can be used in aggregate or as a set of indicators of progress. By selecting a limited set of indicators for which data is already routinely collected, the Misery Index models how you don’t have to track everything to learn something.
Whether you are just beginning a strategic thinking process, or you are engaged in action to pursue a strategy, there’s no time like the present to begin collecting and considering data to inform your (ideally) ever-evolving approach to creating positive change in the community. Don’t let the ideal of a host of indicators or a fancy system to support a “data lake” hold you back. Start where you are and build. One of the most important question you can ask, no matter where you are in the process, is: How can we use data to inform our approach to learning and strategy development?
Comment section